July 29, 2026
Inventory Shrinkage Benchmarks: What's a Normal Rate by Industry?
Inventory Shrinkage Benchmarks: What's a Normal Rate by Industry?
The most common question operators ask about shrinkage isn't "how do I fix it," it's "is my number even bad?" Here's the answer, broken down by industry, with the thresholds that tell you when it's time to act.
What Counts as a Normal Shrinkage Rate?
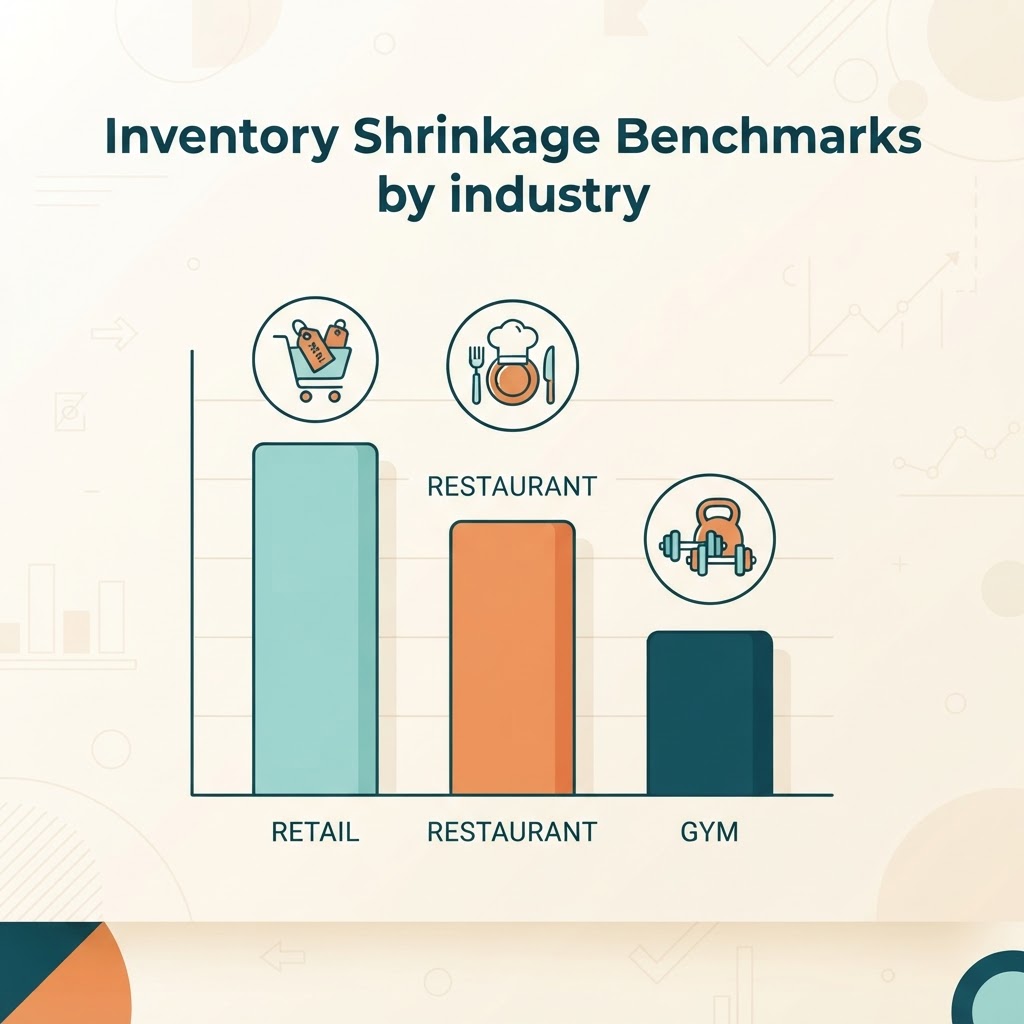
Shrinkage benchmarks vary more by industry than most operators realize. A number that's healthy for a bakery would be a red flag for a boutique. Here's how the major verticals stack up:
| Industry | Normal Shrinkage Range | Why It's Different |
|---|---|---|
| General Retail | 1.0% – 1.68% | Slower-moving product, easier to count and reconcile |
| Restaurants & Food Service | 2.0% – 4.0% | Perishables, portioning variance, prep waste |
| Gyms & Fitness Studios | 1.0% – 3.0% | Retail add-ons (supplements, apparel) plus equipment/supply loss |
| Convenience & Pharmacy | 2.5%+ | High-theft categories, high transaction volume |
The National Retail Federation's overall benchmark is 1.4–1.6% of sales across retail broadly. Use your specific vertical range above, not the blanket number, to judge your own performance.
Where Shrinkage Actually Comes From
Across every vertical we've looked at, the breakdown is remarkably consistent:
- 50–60% administrative error — missed counts, wrong entries, no counts at all
- 20–30% theft — internal and external combined
- 10–20% vendor and spoilage issues — short shipments, expired product, markdown chaos
The takeaway most operators miss: more than half of shrinkage is a process problem, not a people problem. That's the part a weekly counting rhythm actually fixes.
Red Flag Thresholds: When to Worry
Use these as your action triggers, not just your monitoring numbers:
- 5%+ — Something in your process is broken. Time to isolate the source with weekly counts.
- 8%+ — This is actively costing you real margin every month. Treat it as urgent.
- 10%+ — This is often a sign of either a serious process failure or active theft. Investigate immediately, store by store if you're multi-location.
How Weekly Counting Moves the Number
Businesses that move from occasional or annual counts to a standardized weekly rhythm typically cut shrinkage by 30–50% within the first two quarters. The mechanism is simple: you can't fix what you don't see, and you can't see it if you only look once a year. Weekly counts catch drift while it's still small enough to trace back to a cause.
Related reading
For the full breakdown of how to calculate your own shrinkage rate and the five actionable fixes that move it, read Inventory Shrinkage: How to Calculate It and Cut Losses by 30-50%.
Learn more
Start your free 14-day trial to see how TrackItWeekly's weekly counting workflow helps multi-location operators catch shrinkage before it compounds.
Think you know your inventory vocabulary? Prove it.
Six free games built for operators. No signup.